Emancipatory Mapmaking: Lessons from Kibera
Modern mapmaking in the global South has been deeply entwined with the colonial endeavor of producing legible spaces. Critical Geography has emphasized the role of maps in governing populations and their politics of in/visibility, especially concerning marginalized communities. What else can maps do? How can communities and activists deploy mapping technologies as tools that support marginalized communities by promoting recognition, political participation and access to basic services?
Julian Stenmanns (JS) and Till Straube (TS) spoke with Erica Hagen (EH), co-founder of Map Kibera, a community-based open source mapping project in the neighborhood of Kibera in Nairobi, Kenya, about her experiences with participatory mapping and the politics of in/visibility.
JS: What were some of the motivations behind Map Kibera?
EH: Map Kibera started in 2009. The concept came up at a mapping conference in Nairobi. A group of geographers and others were traveling to Nairobi to talk about mapping, and being in Nairobi, you can’t help but notice that Kibera is a really prominent and visible place. It is central to the city and a very large slum area. However, the participants of the conference, who were also interested in open source geography, noticed that Kibera wasn’t mapped at all. Moreover, as we looked for the official registers, we discovered that authorities labeled and designated the area as a forest. Therefore, we wanted to change this, not from the viewpoint of an international NGO, but rather mapping it from the perspective of the residents.
TS: How did you go about starting the project?
EH: We began by teaming up with a local community service organization that was willing to host us and introduce us to the community. That was key because we couldn’t just walk around by ourselves. Simply showing up would be very hard. You would get lost within five minutes if you aren’t from the area. In addition, you could end up in a precarious situation, not necessarily dangerous, but there is bit of resistance to outsiders just wandering around. Furthermore, mapping from the outside was no option for us. Besides, when you look at satellite imagery of the area, there is not much that you can see in terms of details of the features, which is also due to the density.
JS: Can you tell us about the work processes that went into making the actual map? What would your typical day look like?
EH: First we recruited some young adults between 18 and 25 years old who lived in the area. They were familiar with the neighborhood and involved in the community. Seven years ago, smart phones and computers were not widely distributed in Kibera. Therefore, they first had to familiarize themselves with the GPS devices. We had at least one person from each of Kibera’s thirteen villages, and we told them to map what they felt was important to be visible in their village. This was the beginning of a waypoint collection, just by pushing the button of the GPS device and writing down whatever the place was. We didn’t really give them any more instructions. So
it was up to them what they were going to mark. That way we made sure to keep the map as locally informed as possible.
TS: In retrospect, are there some things that would have been useful to know when starting out? What were the steep parts of the learning curve?
EH: The challenges that we hadn’t expected were more of a social than of a technological nature. We weren’t really able to pay people. However, we realized that they spent all day with pretty tiring work and they were expecting to have at least some kind of compensation. So we arranged for a little stipend. Moreover, later on it became more of a challenge of how to make it all part of the big picture: How do we make this information as relevant as possible for the community?
JS: Speaking of the community, what kind of maps – mental or otherwise – existed prior to Map Kibera?
EH: Yes, there were a couple of different ones. The spatial comprehension in the communities was pretty interesting. The main navigation method is based on landmarks. Therefore, we wanted to make sure that we got the major landmarks on the map. We didn’t expect people to use the map to go to the grocery store in the community. Rather, we started with printing out sectoral maps. For example, we put all health-related places together in one map and shared it with the community. This way the bigger picture of health in Kibera became visible and could also be used when facing government officials.
TS: The technology of cartography comes with some historical baggage. What did it mean for you to engage in mapmaking in a postcolonial context?
EH: If we dealt with these issues it was on a very local, concrete level. Although many aspects of life in Kibera are actually pretty formalized, it remains an informal settlement without official approval, and inhabitants are very aware of this issue. Government maps designate the site of Kibera as a forest area. In many ways, becoming visible on the map was a matter of pride for the people we worked with.
JS: What does it mean to put Kibera on the map in a political sense? What are the concrete political achievements and the achievements of putting Kibera on the map?
EH: Over the past few years, we’ve been working with local schools. In Kibera, there are around 300 schools, many of them organized by non-state providers. So none of the people who are providers of those schools or who teach there seemed to be represented in this way. The map legitimizes their work. A local government officer of education started copying the maps and distributing them to help show others the education landscape of Kibera. In the individual schools, the maps and all the information they contain become somewhat part of the curriculum. It also became widely known that government schools covered only few of the students, which became a point the Kibera Minister of Parliament used to try to draw more resources.
TS: Your map grants visibility on a global scale. What are the consequences of putting local knowledge into the public domain?
EH: Yes, there definitely has been a lot of visibility through the map. Without the map, nobody would have paid much attention to that specific little dot on the map. So how did we deal with this visibility? I guess the main way was to ask ourselves if the mapping process and its product would put people at risk. Because Kibera and other places like it are contested and vulnerable locations, especially given the fact that there is a lot of activity that is not formalized. Most slums get their electricity through informal connections to the grid. But we wanted to emphasize the aspect of protection through visibility. Becoming more visible can also lead to more protection because things that happen can be known – even globally – and that provides people with a sense of security. Whoever tries to do a crack down on informal housing will become very visible. Finally, people in Kibera have a strong sense of community and they will say: This thing we don’t want to be known, so we don’t want to put it on the map. So that’s the guideline we followed. We just followed the people’s lead – and they tend to imagine a lot more visibility than what is actually there.
JS: How did the nature of OpenStreetMap as your main platform inform the goals of the project or its emancipatory potential? Would this have been possible with a paper map?
EH: Map Kibera as a paper map as in offline only? No, that would definitely not have been possible since we really intended to connect to wider audience. This thing is more than a data tool; it is a communication and broadcasting tool, so by definition this requires the internet and information technology. This way the community can update its map so it is truly an open, participatory map of and by the community. We did, however, distribute printed maps as well, and this has been a key to making sure the information reaches more local people. The schools maps were given to each school on paper. So it is important to consider the best ways to access people as well as allow them to take part in digital open mapping.
TS: Thank you for the interview.
Conclusion
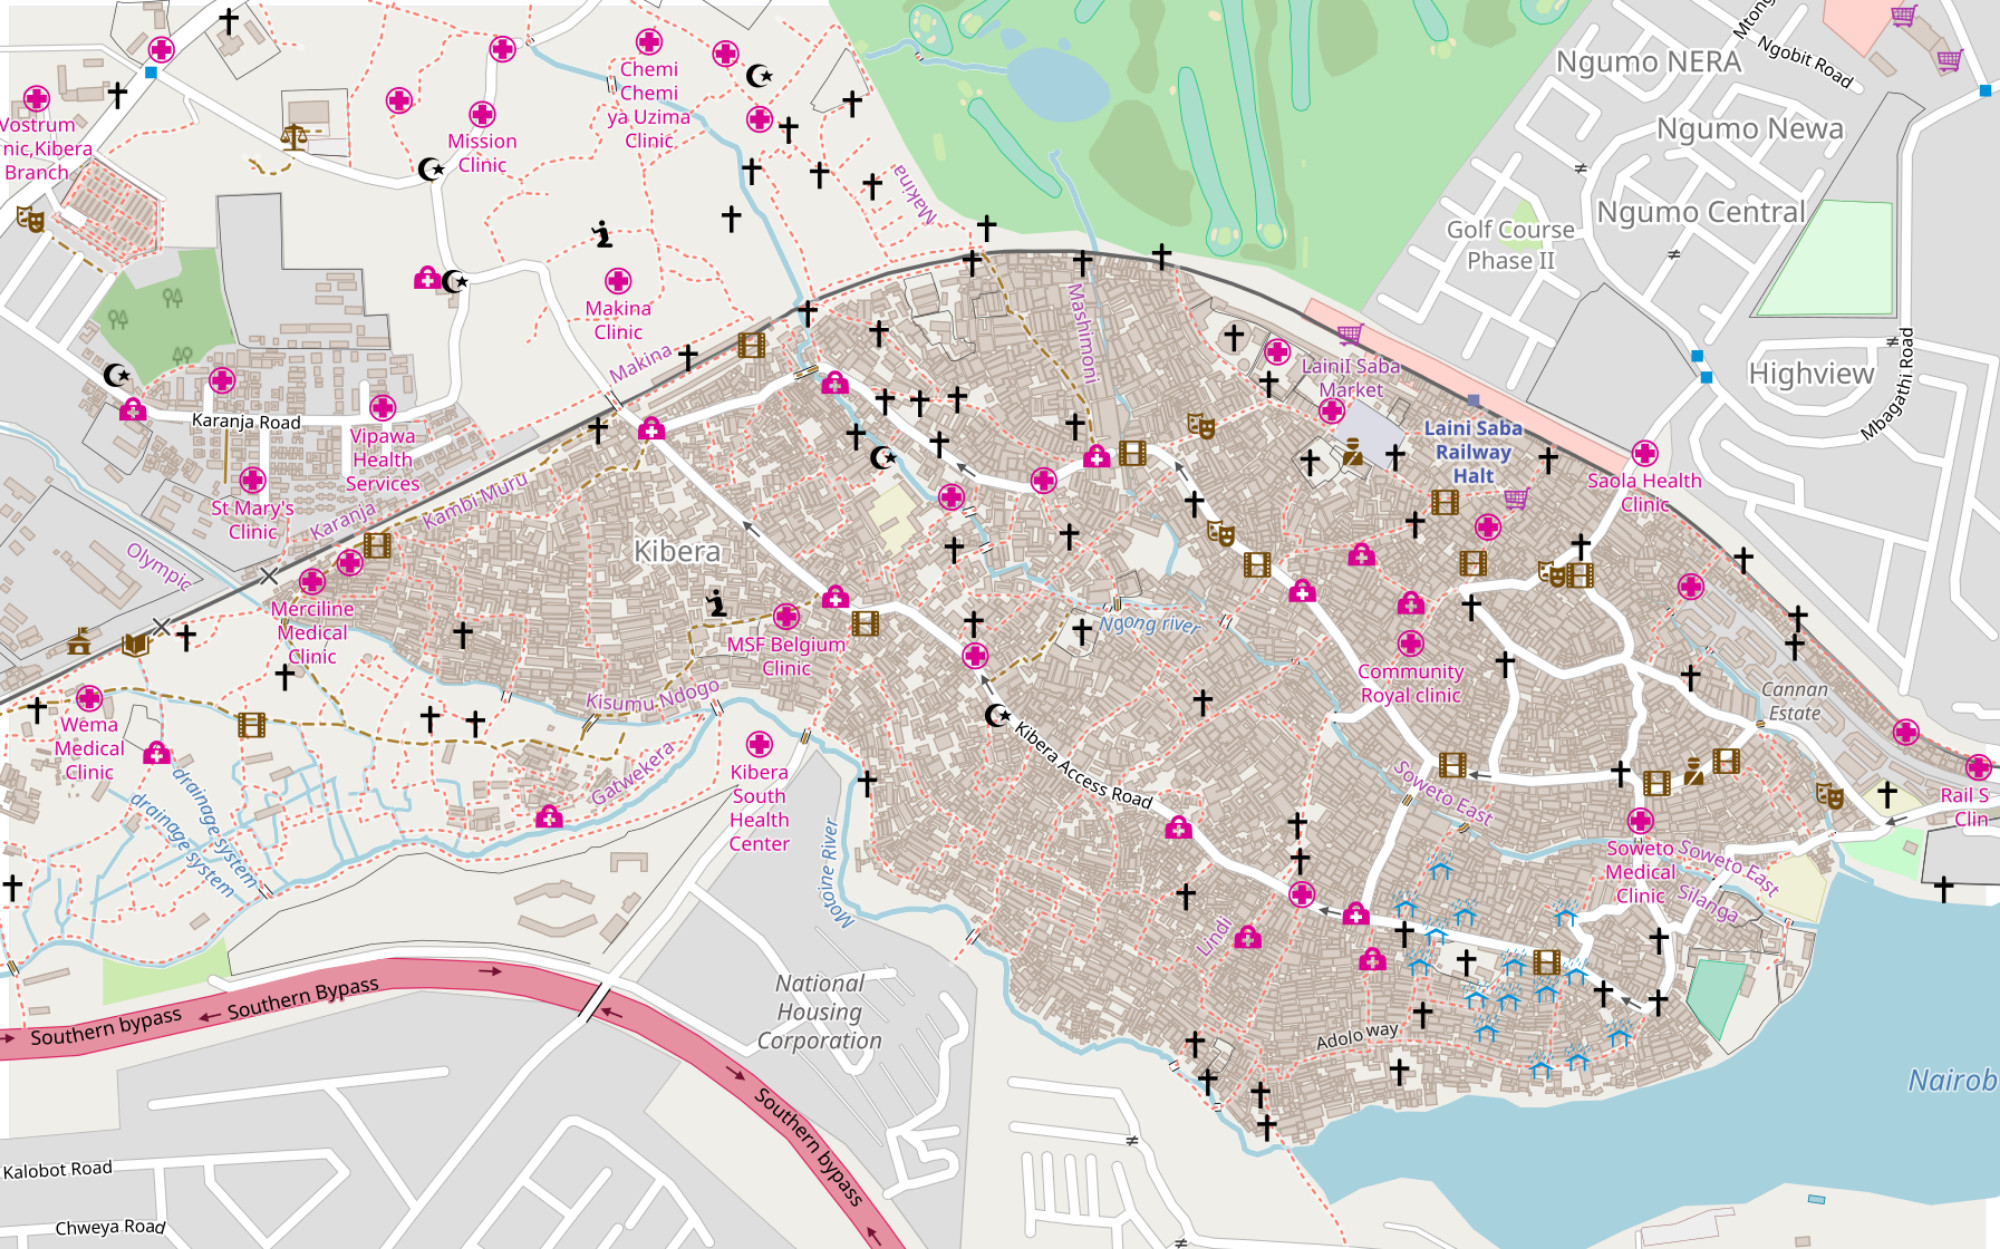
After speaking with Erica Hagen, we revisited the different representations of Kibera on GoogleMaps and OpenStreetMap. When comparing the two maps side by side, the difference is indeed striking: while the visualization on Google’s platform in no way suggests a dense and vibrant neighborhood, Map Kibera’s data on Open Street Map lends itself to be read as a bottom-up mapping of locations that matter to the community. Since its start in 2009, Map Kibera has thus been facilitating an alternative cartographic articulation of Kibera, available to both its residents and to people remotely accessing online maps of the area.
Finally, while we agree with Erica Hagen’s elaborations on the merits of the Map Kibera project and community mapping in general, we also want to draw attention to the ambiguities that inherently accompany undertakings of mapping marginalized communities. Cartography is deeply rooted in a specific way of seeing. Google’s Beyond the Map project employs drones and cameras mounted on motor scooters to explore Rio de Janeiro’s favelas, an “uncharted and mysterious spot on the map […]” (Google 2017). Not only is this language revealing when it comes to who sees and who is seen, but Google is actively pushing the frontier of what is visible, accessible and governable into terrains previously indiscernible for capital and the state (Luque-Ayala & Neves Maia 2018). This aspect is certainly reminiscent of the colonial project of rendering populations and spaces legible through cartography. It is therefore a key challenge for community mapping projects to be aware of the complex politics of in/visibility and to discern ways to realize their emancipatory potential within this field of tension.
References
Google 2017. Google Presents Beyond the Map. beyondthemap.withgoogle.com, 19 May 2017.
Luque-Ayala, A. & Neves Maia, F. 2018. Digital territories: Google maps as a political technique in the re-making of urban informality. Environment and Planning D: Society and Space, 0: 1–19.
Illustrations
Mapright column: Kibera and surrounding areas as they appear on OpenStreetMap. © OpenStreetMap contributors.
Photograph with title ‘Lucy Fondo of Map Kibera assists a teacher in Kibera in finding their school on the map’ by Kibera Trust.
Photograph with title ‘Douglas Namale maps a school in Kibera for Map Kibera’s Open Schools Kenya project’, by Kibera Trust.
Photograph with title ‘A wall in Kibera is painted with the security map created by Map Kibera’, by Kibera Trust.
Gallery


